Introducing InferenceX: Open Source vLLM Benchmarking for Multi-GPU Inference
I built InferenceX, an open-source tool for benchmarking LLM inference across different GPU configurations. It measures throughput, latency, TTFT, and real power efficiency using nvidia-smi. Works with any HuggingFace model that vLLM supports.
GitHub: https://github.com/strangeloopio/inferencex
Why I Built This
When deploying LLMs in production, you face questions that are hard to answer without real data:
- How many GPUs should I use for my model?
- What's the optimal number of concurrent users?
- Is 4-GPU tensor parallelism worth the cost?
- What's my actual power efficiency?
Existing benchmarks don't let you test YOUR model with YOUR configuration on YOUR cloud provider. I wanted a tool that works with any HuggingFace model, tests multiple GPU configurations automatically, measures real power consumption (not estimates), runs on serverless GPUs, and generates publication-ready comparison charts.
Architecture
InferenceX runs on Modal's serverless GPU infrastructure. Here's how it works:
┌─────────────────────────────────────────────────────────────────┐
│                         Modal Cloud                              │
│  ┌─────────────┐  ┌─────────────┐  ┌─────────────┐              │
│  │   1 GPU     │  │   2 GPU     │  │   4 GPU     │              │
│  │  Endpoint   │  │  Endpoint   │  │  Endpoint   │              │
│  │  (vLLM)     │  │  (vLLM TP)  │  │  (vLLM TP)  │              │
│  └─────────────┘  └─────────────┘  └─────────────┘              │
│         │                │                │                      │
│         └────────────────┼────────────────┘                      │
│                          │                                       │
│                 ┌────────▼────────┐                              │
│                 │  Power Monitor  │                              │
│                 │  (nvidia-smi)   │                              │
│                 └────────┬────────┘                              │
│                          │                                       │
│                 ┌────────▼────────┐                              │
│                 │  Modal Volume   │                              │
│                 │  (power logs)   │                              │
│                 └─────────────────┘                              │
└─────────────────────────────────────────────────────────────────┘
                           │
                           ▼
┌─────────────────────────────────────────────────────────────────┐
│                    Local / GitHub Actions                        │
│  ┌─────────────────┐  ┌─────────────────┐  ┌─────────────────┐  │
│  │ benchmark_      │  │ plot_           │  │ Results:        │  │
│  │ gpu_users.py    │──│ gpu_users.py    │──│ - JSON          │  │
│  │ (async HTTP)    │  │ (matplotlib)    │  │ - PNG chart     │  │
│  └─────────────────┘  └─────────────────┘  └─────────────────┘  │
└─────────────────────────────────────────────────────────────────┘
The Modal deployment creates three separate vLLM endpoints:
- 1 GPU endpoint - Single GPU inference (baseline)
- 2 GPU endpoint - Tensor parallelism across 2 GPUs
- 4 GPU endpoint - Tensor parallelism across 4 GPUs
Each endpoint runs vLLM with an OpenAI-compatible API, making it easy to test with standard HTTP clients.
Power Monitoring
InferenceX captures real nvidia-smi measurements:
- Logs every 1 second during inference
- Captures: power draw, temperature, GPU utilization, memory usage
- Stored to Modal Volume as CSV files
- Only readings with GPU utilization > 5% count toward efficiency
This gives you actual power efficiency numbers (tokens/s/kW).
Configuration Options
InferenceX supports any HuggingFace model that works with vLLM. Supported GPUs: H100 (default), H200, B200.
Three key benchmark parameters control the workload:
- REQUESTS - Number of inference calls per configuration (default: 50)
- ISL (Input Sequence Length) - Number of tokens in input prompt (512-1024 for chat, 2048-4096 for document analysis, 8192+ for long context)
- OSL (Output Sequence Length) - Maximum tokens generated per request (256 for short responses, 1024 for detailed explanations, 4096 for long-form content)
By default, InferenceX tests 6 GPU/user configurations to help identify optimal GPU count, concurrency, and trade-offs between throughput and user experience.
Running InferenceX
Option 1: Local
# Setup
git clone https://github.com/strangeloopio/inferencex.git
cd inferencex
python -m venv venv && source venv/bin/activate
pip install -r requirements.txt
python -m modal setup

# Deploy endpoints
python -m modal deploy vllm_multi_gpu.py

# Run benchmark
python benchmark_gpu_users.py \
  --url-1gpu "https://<workspace>--vllm-multi-gpu-benchmark-serve-1gpu.modal.run" \
  --url-2gpu "https://<workspace>--vllm-multi-gpu-benchmark-serve-2gpu.modal.run" \
  --url-4gpu "https://<workspace>--vllm-multi-gpu-benchmark-serve-4gpu.modal.run"

# Download power logs
python -m modal run vllm_multi_gpu.py --action logs
python -m modal run vllm_multi_gpu.py --action "download power_log_1gpu_*.csv"

# Generate chart
python plot_gpu_users.py

# Stop (save costs)
python -m modal app stop vllm-multi-gpu-benchmark
Option 2: GitHub Actions
For automated benchmarking without local setup:
- Fork the repository
- Add secrets: MODAL_TOKEN_ID, MODAL_TOKEN_SECRET, MODAL_WORKSPACE
- Go to Actions -> "vLLM Multi-GPU Benchmark" -> Run workflow
- Configure ISL, OSL, GPU type, model name
- Download results from Artifacts
The workflow automatically deploys endpoints, runs benchmarks, downloads power logs, generates charts, stops Modal app (saves costs), and uploads artifacts (retained 90 days).
Metrics Explained
InferenceX measures five key metrics:
- Throughput Per GPU (tokens/s/GPU) - Total tokens generated divided by (time x GPU count). Higher is better. Shows how efficiently you're using each GPU.
- End-to-End Latency (seconds) - Average time from request submission to complete response. Lower is better. What users experience as "response time."
- User Interactivity (tokens/s/user) - Tokens generated per second per concurrent user. Higher is better. How fast text streams to each individual user.
- Time To First Token (seconds) - Time until the first token is generated. Lower is better. Critical for perceived responsiveness in chat.
- Power Efficiency (tokens/s/kW) - Throughput divided by actual measured power consumption. Higher is better. Real cost efficiency metric.
Sample Results
Here's what I found benchmarking Qwen3-8B-FP8 on H100 (ISL=1024, OSL=256):
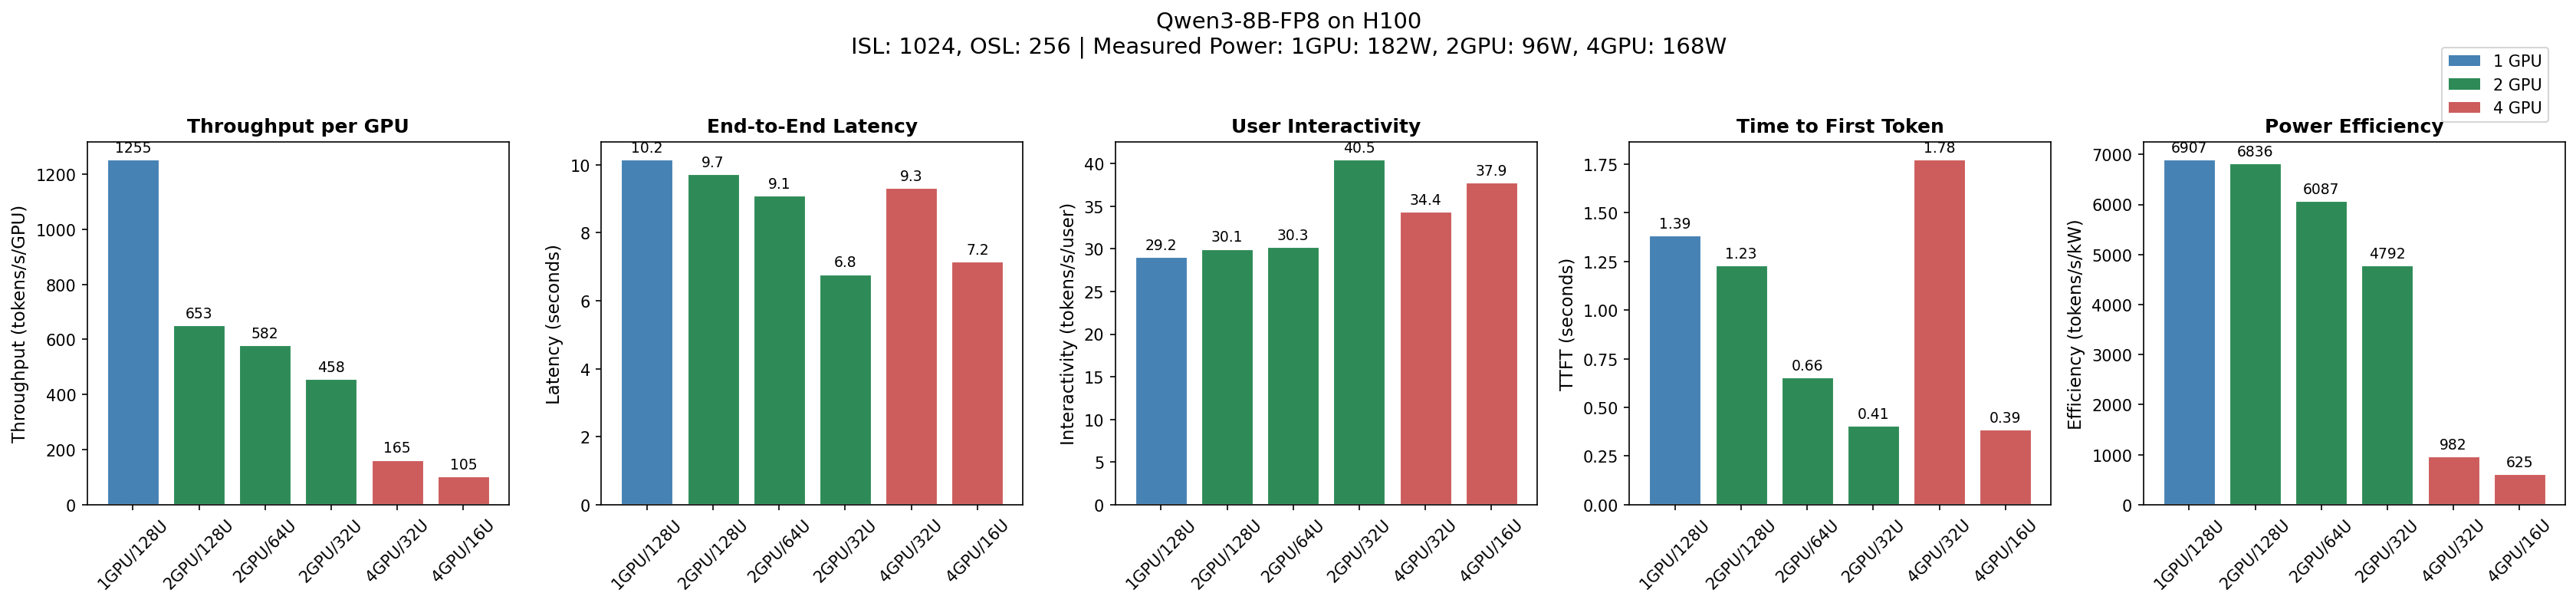
Config       Thru/GPU      Latency   Interactivity   TTFT    Power Eff.
             (tok/s/gpu)   (s)       (tok/s/user)    (s)     (tok/s/kW)
-----------------------------------------------------------------------
1GPU/128U    1,255         10.2      29.2            1.39    6,907
2GPU/128U    653           9.8       30.1            1.23    6,836
2GPU/64U     582           9.1       30.3            0.66    6,087
2GPU/32U     458           6.8       40.5            0.41    4,792
4GPU/32U     165           9.4       34.4            1.78    982
4GPU/16U     105           7.2       37.9            0.39    625
Key findings for this model:
- 1 GPU is optimal for throughput (1,255 tok/s/GPU)
- 2 GPU / 32 users is optimal for user experience (6.8s latency)
- 4 GPU is wasteful—10x worse power efficiency
But YOUR model may behave differently.
Cost & Time
Default benchmark (Qwen3-8B-FP8, 50 requests, 6 configurations):
- Time: ~13 minutes
- Cost: ~$12 on Modal (as of November 2024)
Costs scale with model size (larger models = longer load time), request count (more requests = longer benchmark), and ISL/OSL (longer sequences = more compute).